Picture a classroom where students easily grasp complex ideas and remember what they learn weeks later. This isn’t wishful thinking – it happens when teachers use graphic organisers as powerful learning tools. These visual aids transform abstract concepts into clear, organised displays that make sense to all types of learners.
Graphic organisers help students process information more effectively by turning complicated ideas into simple visual formats that the brain can understand and remember. Whether you’re working with mind maps, flowcharts, or comparison charts, these tools create bridges between new information and existing knowledge. Students naturally engage more when they can see how ideas connect and relate to each other.
The journey to mastering graphic organisers involves understanding key principles, exploring different types of visual tools, and learning practical ways to use them in your teaching. By the end of this guide, you’ll have concrete strategies to boost student comprehension and make your lessons more engaging. Furthermore, you’ll discover how these simple visual tools can transform the way your students learn across all subject areas.
Core Principles of Using Graphic Organisers to Enhance Learning
Graphic organisers work by creating clear visual structures that help students process information more effectively. They support better understanding by connecting new ideas to existing knowledge whilst reducing mental overload.
How Graphic Organisers Improve Comprehension and Retention
Visual organisation helps your brain store information more effectively. When you see information arranged in charts, maps, or diagrams, your mind creates stronger memory pathways.
Graphic organisers move information from short-term memory into long-term storage. This happens because the visual structure gives your brain multiple ways to remember the same content.
Key benefits for memory include:
- Clearer connections between ideas
- Reduced mental confusion
- Better recall during tests
- Stronger understanding of relationships
Your comprehension improves when complex text becomes visual patterns. Instead of reading long paragraphs, you can see how different pieces fit together.
What’s more, research shows that students remember 65% more information when it includes visual elements. This improvement happens across all subjects and age groups.
The visual structure also helps you identify gaps in your understanding. When you create a graphic organiser, missing connections become obvious.
Role in Breaking Down Complex Concepts
Complex concepts become manageable when you break them into smaller parts. Graphic organisers show you exactly how to divide difficult topics into simpler pieces.
Effective breakdown strategies include:
- Starting with main ideas first
- Adding supporting details gradually
- Showing cause and effect relationships
- Connecting related concepts visually
Your analytical thinking improves when you can see each part separately. This process helps you understand how individual elements contribute to the whole concept.
What’s more, creativity develops naturally as you arrange information logically. You begin to question relationships and evaluate evidence more carefully.
The step-by-step approach reduces overwhelm. Moreover, instead of facing one massive topic, you tackle several smaller, manageable sections.
To conclude, sequential organisation also reveals patterns you might miss otherwise. These patterns help you predict outcomes and make better connections.
Boosting Student Engagement and Achievement
Visual learning appeals to different learning styles simultaneously. Students who struggle with text-only materials often succeed when information appears in graphic format.
Your engagement increases when you actively create organisers rather than passively reading. Thus, the hands-on process keeps your attention focused on the content.
Engagement improves through:
- Active participation in learning
- Personal control over information layout
- Immediate visual feedback
- Reduced reading fatigue
Student achievement rises consistently when graphic organisers support regular instruction. Test scores improve across reading, writing, and other KLA subjects.
In addition, graphic organisers particularly help students with learning difficulties. Visual structure compensates for challenges with traditional text-based learning methods.
Your confidence grows as complex information becomes clearer. This increased confidence leads to better performance and willingness to tackle challenging topics.
The immediate visual feedback shows your progress clearly. Moreover, you can see your understanding develop as you complete each section of the organiser.
Types of Graphic Organisers and Their Educational Applications
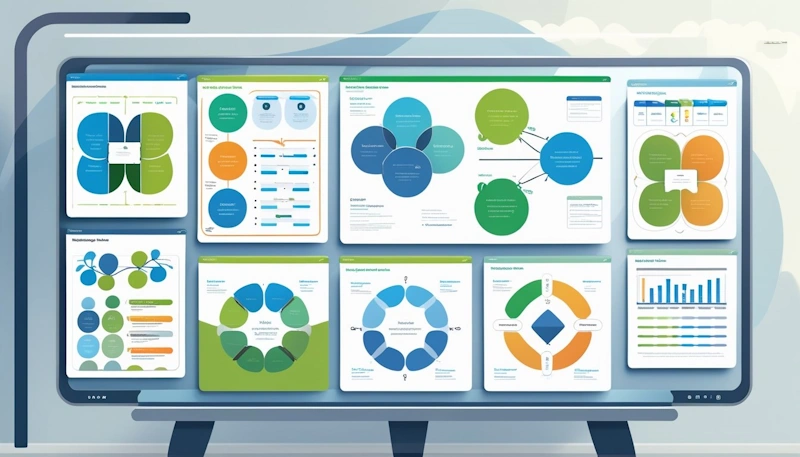
Different graphic organisers serve specific learning purposes, from comparing ideas to organising complex concepts and tracking learning progress. These visual tools support various learning styles while helping you achieve specific learning objectives through structured formats.
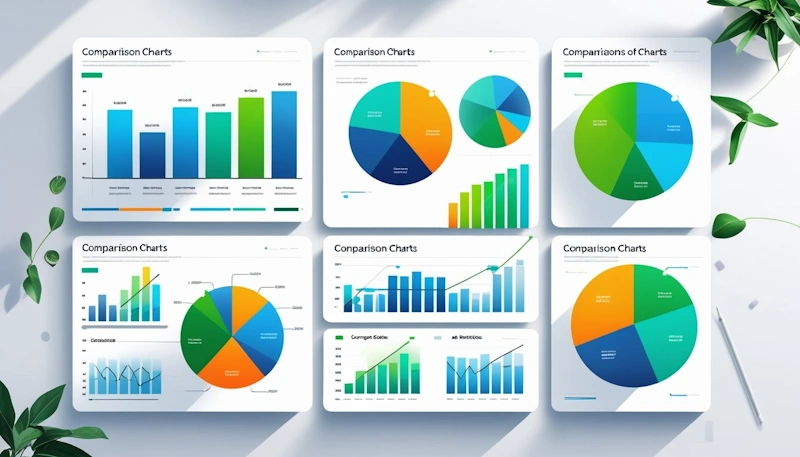
Venn Diagrams and T Charts for Comparisons
Venn diagrams use overlapping circles to show similarities and differences between topics. The overlapping section displays what topics share in common. The separate sections highlight unique features of each topic.
Furthermore, these visual tools work well for reading comprehension activities. You can compare characters in stories or analyse different historical events. Students often find it easier to understand complex relationships when they see them visually.
T charts provide another way to compare and contrast ideas. They use two columns to separate different aspects of topics. One side shows similarities while the other shows differences.
Venn Diagrams | T Charts |
Shows overlapping relationships | Clear two-column format |
Works for 2+ topics | Simple comparison structure |
Visual circle format | Quick to create and use |
Both templates help students organise their thinking before writing essays. Thus, teachers can use these tools to assess student understanding during lessons.
Mind Maps, Concept Maps, and Flow Charts for Idea Organisation
Mind maps start with a central topic and branch out into related ideas. Each branch connects to the main concept through lines or arrows. This format matches how your brain naturally connects information.
These visual tools work especially well for brainstorming sessions. Students can explore all aspects of a topic without losing track of connections. Mind maps support different learning styles by combining words with visual elements.
Concept maps show relationships between multiple ideas using connecting words. Unlike mind maps, they can have several starting points. The connections explain how concepts relate to each other.
Flow charts display step-by-step processes in a logical order. They use shapes like rectangles and diamonds to show different types of information. Arrows guide readers through each step of the process.
Ultimately, these graphic organisers help students break down complex topics into smaller parts. Teachers often use them to introduce new concepts or review difficult material.
KWL Charts, Timelines, and Story Maps for Sequencing and Reflection
KWL charts have three columns: Know, Want to know, and Learned. You fill out the first two columns before studying a topic. The third column gets completed after the lesson ends.
This template helps connect new information to what students already understand. Teachers can see what students need to learn most. The format encourages active participation in the learning process.
Furthermore, timelines arrange events in the order they happened. They help students understand how events connect over time. History lessons often use timelines to show cause and effect relationships.
Story maps break down narrative elements like characters, setting, and plot. They improve reading comprehension by highlighting key story components. Students can track character development and identify main themes.
To conclude, these visual tools support reflection and help students see patterns in information. Each template serves different learning objectives while maintaining clear, organised formats.
Implementing Graphic Organisers Effectively in Teaching Practices
Successfully implementing graphic organisers requires careful planning that connects visual tools with lesson goals, adapts to different student needs, and creates supportive classroom environments. Furthermore, effective teaching practices include clear modelling and ongoing feedback to maximise student learning outcomes.
Integrating Graphic Organisers With Lesson Planning
Start by aligning graphic organisers directly with your learning objectives. Choose specific tools that match what you want students to achieve in each lesson.
For reading comprehension, use story maps to help students track characters and plot. When teaching science concepts, flowcharts work well to show processes step by step.
Plan when to introduce the graphic organiser during your lesson. You can use them as warm-up activities, during main instruction, or as review tools.
Key integration strategies:
- Match the organiser type to your lesson goals
- Introduce tools at the right moment in your lesson
- Connect visual aids to existing curriculum content
- Prepare digital versions for ICT integration
To start, make sure your chosen graphic organisers support effective teaching rather than adding extra work. Simple tools often work better than complex ones for student learning.
Next, consider how the visual aids will help different types of learners in your classroom. Visual learners especially benefit from seeing information organised clearly.
Adapting for Diverse Students and Learning Disabilities
Students with learning disabilities often need modified graphic organisers to succeed. Start with simpler formats and add complexity gradually as students gain confidence.
Finally, for students with reading difficulties, use organisers with more pictures and fewer words. Colour-coding different sections helps students with attention challenges stay focused.
Adaptation techniques:
- Reduce text amount for struggling readers
- Add visual symbols alongside words
- Provide partially completed templates
- Offer digital tools with text-to-speech features
Some students need extra scaffolding when using these visual tools. Begin by completing organisers together as a class before asking students to work independently.
ICT tools can provide additional support for diverse learners. Digital graphic organisers often include features like spell-check and audio support.
Remember that some students may need one-on-one guidance to understand how graphic organisers work. Take time to model the process clearly for these students.
Modelling, Feedback, and Encouraging Collaboration
Always model how to use graphic organisers before expecting students to use them independently. Show your thinking process as you fill in each section.
Use a document camera or interactive whiteboard to demonstrate. Talk through your decisions as you organise information into different parts of the visual tool.
Effective modelling steps:
- Show a completed example first
- Complete one together with student input
- Guide students through their first attempt
- Allow independent practice with support
Firstly, provide specific feedback on how students use their graphic organisers. Focus on the thinking process rather than just the final product.
Next, encourage students to work in pairs or small groups when learning new organiser types. Collaboration helps students learn from each other’s approaches.
Furthermore, create opportunities for students to share their completed organisers with the class. This builds confidence and shows different ways to organise the same information.
Moreover, regular feedback helps students improve their use of these visual learning tools over time.
Conclusion
In conclusion, using graphic organisers in education not only supports clearer understanding but also encourages deeper engagement with learning materials.
To add, these visual strategies help students organise their thoughts, identify connections, and retain information more effectively.
Therefore, by integrating graphic organisers into daily instruction, educators can create more inclusive and impactful learning experiences.
Ultimately, this approach empowers students to take ownership of their learning while fostering critical thinking and creativity.
What do you think—how could graphic organisers make a difference in your own teaching or learning journey?
Resources of Mine You Might Like
Want Access to my Free Resource Library?

About The Author
Hi! My name is Mr Mac. I am a K – 6 teacher. I love to create resources for teachers to make their teaching lives easier.